Find High-impact Performance Bottlenecks in Django
Introduction
When optimizing performance of web application, a common mistake is to start with optimizing the slowest page(or API). In addition to considering response time, we should also consider the traffic it is receving to priorotize the order of optimization.
In this article we will profile a django webapp, find high-impact performance bottlenecks and then start optimization them to yield better performance.
Profiling
django-silk is an open source profiling tool which intercepts and stores HTTP requests data. Install it with pip.
pip install django-silk
Add silk to installed apps and include silk middleware in django settings.
MIDDLEWARE = [
    ...
    'silk.middleware.SilkyMiddleware',
    ...
]

INSTALLED_APPS = (
    ...
    'silk'
)
Run migrations so that Silk can create required database tables to store profile data.
$ python manage.py makemigrations
$ python manage.py migrate
$ python manage.py collectstatic
Include silk urls in root urlconf to view the profile data.
urlpatterns += [url(r'^silk/', include('silk.urls', namespace='silk'))]
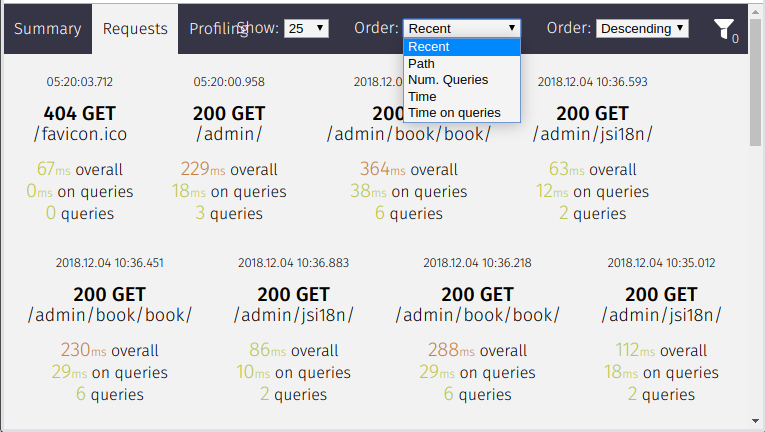
On silk requests page(http://host/silk/requests/), we can see all requests and sort them by overall time or time spent in database.
High Impact Bottlenecks
Silk creates silk_request table which contains information about the requests processed by django.
$ pgcli

library> \d silk_request;

+--------------------+--------------------------+-------------+
| Column             | Type                     | Modifiers   |
|--------------------+--------------------------+-------------|
| id                 | character varying(36)    |  not null   |
| path               | character varying(190)   |  not null   |
| time_taken         | double precision         |  not null   |
...
We can group these requests data by path, calculate number of requests, average time taken and impact factor of each path. Since we are considering response time and traffic, impact factor will be product of average response time and number of requests for that path.
library> SELECT
     s.*, round((s.avg_time * s.count)/max(s.avg_time*s.count) over ()::NUMERIC,2) as impact
 FROM
     (select path, round(avg(time_taken)::numeric,2) as avg_time, count(path) as count from silk_request group by PATH)
     s
 ORDER BY impact DESC;

+-------------------------+------------+---------+----------+
| path                    | avg_time   | count   | impact   |
|-------------------------+------------+---------+----------|
| /point/book/book/       | 239.90     | 1400    | 1.00     |
| /point/book/data/       | 94.81      | 1900    | 0.54     |
| /point/                 | 152.49     | 900     | 0.41     |
| /point/login/           | 307.03     | 400     | 0.37     |
| /                       | 106.51     | 1000    | 0.32     |
| /point/auth/user/       | 494.11     | 200     | 0.29     |
...
We can see /point/book/book/ has highest impact even though it is neighter most visited nor slowest view. Optimizing this view first yields in overall better performance of webapp.
Conclusion
In this article, we learnt how to profile django webapp and identify bottlenecks to improve performance. In the next article, we wil learn how to optimize these bottlenecks by taking an in-depth look at them.
Need further help with this? Feel free to send a message.

Anand Reddy Pandikunta (ChillarAnand)
Improving Health & Wealth with Technology