Alexa vs Domcop vs Majestic - Top Million Sites

Introduction

Alexa1, Domcop2(based on CommonCrawl3 data) Majestic4 & provide top 1 million popular websites based on their analytics. In this article we will download this data and compare them using Linux command line tools.

Collecting data

Let's download data from above sources and extract domain names. The data format is different for each source. We can use awk tool to extract domains column from the source. After extracting data, sort it and save it to a file.

Extracting domains from alexa.

# alexa

$ wget http://s3.amazonaws.com/alexa-static/top-1m.csv.zip

$ unzip top-1m.csv.zip

# data sorted by ranking
$ head -n 5 top-1m.csv
1,google.com
2,youtube.com
3,facebook.com
4,baidu.com
5,wikipedia.org

$ awk -F "," '{print $2}' top-1m.csv | sort > alexa

# domains after sorting alphabetically
$ head -n 5 alexa
00000.life
00-000.pl
00004.tel
00008888.tumblr.com
0002rick.tumblr.com

Extracting domain names from domcop.

# Domcop

$ wget https://www.domcop.com/files/top/top10milliondomains.csv.zip

$ unzip top10milliondomains.csv.zip

# data sorted by ranking
$ head -n 5 top10milliondomains.csv
"Rank","Domain","Open Page Rank"
"1","fonts.googleapis.com","10.00"
"2","facebook.com","10.00"
"3","youtube.com","10.00"
"4","twitter.com","10.00"

$ awk -F "\"*,\"*" '{if(NR>1)print $2}' top10milliondomains.csv.zip | sort > domcop

# domains after sorting alphabetically
$ head -n 5 domcop
00000000b.com
000000book.com
0000180.fortunecity.com
000139418.wixsite.com
000fashions.blogspot.com

Extracting domain names from majestic.

# Majestic

$ wget http://downloads.majestic.com/majestic_million.csv

# data sorted by ranking
$ head -n 5 majestic_million.csv
GlobalRank,TldRank,Domain,TLD,RefSubNets,RefIPs,IDN_Domain,IDN_TLD,PrevGlobalRank,PrevTldRank,PrevRefSubNets,PrevRefIPs
1,1,google.com,com,474277,3016409,google.com,com,1,1,474577,3012875
2,2,facebook.com,com,462854,3093315,facebook.com,com,2,2,462860,3090006
3,3,youtube.com,com,422434,2504924,youtube.com,com,3,3,422377,2501555
4,4,twitter.com,com,412950,2497935,twitter.com,com,4,4,413220,2495261

$ awk -F "\"*,\"*" '{if(NR>1)print $2}' majestic_million.csv | sort > majestic

# domains after sorting alphabetically
$ head -n 5 majestic
00000.xn--p1ai
0000666.com
0000.jp
0000www.com
0000.xn--p1ai

Comparing Data

We have collected and extracted domains from above sources. Let's compare the domains to see how similar they are using comm tool.

$ comm -123 alexa domcop --total
871851  871851  128149  total

$ comm -123 alexa majestic --total
788454  788454  211546  total

$ comm -123 domcop majestic --total
784388  784388  215612  total
$ comm -12 alexa domcop | comm -123 - majestic --total
31314   903165  96835   total

So, only 96,835(9.6%) domains are common between all the datasets and the overlap between any two sources is ~20%. Here is a venn diagram showing the overlap between them.

Conclusion

We have collected data from alexa, domcorp & majestic, extracted domains from it and observed that there is only a small overlap between them.
Setup Continous Deployment For Python Chalice

Outline

Chalice is a microframework developed by Amazon for quickly creating and deploying serverless applications in Python.

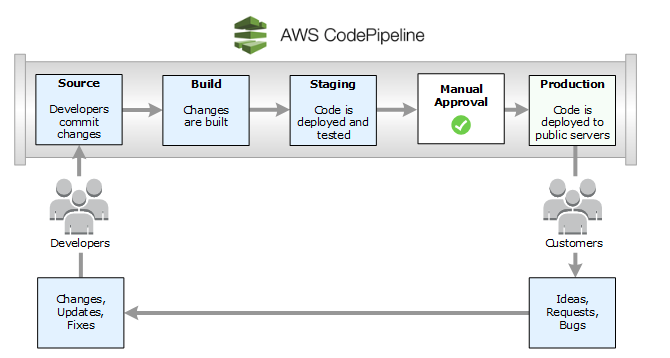
In this article, we will see how to setup continous deployment with GitHub and AWS CodePipeline.

CD Setup

Chalice provides cli command deploy to deploy from local system.

Chalice also provides cli command generate-pipeline command to generate CloudFormation template. This template is useful to automatically generate several resources required for AWS pipeline.

This by default uses CodeCommit repository for hosting code. We can use GitHub repo as a source instead of CodeCommit.

Chalice by default provides a build file to package code and push it to S3. In the deploy step, it uses this artifact to deploy the code.

We can use a custom buildpsec file to directly deploy the code from build step.

version: 0.1

phases:
  install:
    commands:
      - echo Entering the install phase
      - echo Installing dependencies
      - sudo pip install --upgrade awscli
      - aws --version
      - sudo pip install chalice
      - sudo pip install -r requirements.txt

  build:
    commands:
      - echo entered the build phase
      - echo Build started on `date`
      - chalice deploy --stage staging

This buildspec file install requirements and deploys chalice app to staging. We can add one more build step to deploy it production after manual intervention.

Conclusion

We have seen how to setup continous deployment for chalice application with GitHub and AWS CodePipeline.

Parsing & Transforming mitmproxy Request Flows

mitmproxy is a free and open source interactive HTTPS proxy. It provides command-line interface, web interface and Python API for interaction and customizing it for our needs.

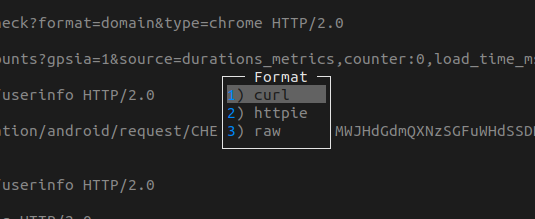
mitmproxy provides an option to export web request flows to curl/httpie/raw formats. From mitmproxy, we can press e(export) and then we can select format for exporting.

Exporting multiple requests with this interface becomes tedious. Instead we can save all requests to a file and write a python script to export them.

Start mitmproxy with this command so that all request flows are appended to requests.mitm file for later use.

$ mitmproxy -w +requests.mitm

Here is a python script to parse this dump file and print request URLs.

from mitmproxy.io import FlowReader


filename = 'requests.mitm'

with open(filename, 'rb') as fp:
    reader = FlowReader(fp)

    for flow in reader.stream():
        print(flow.request.url)

flow.request object has more attributes to provide information about the request.

In [31]: dir(flow.request)
Out[31]:
[...
 'host',
 'host_header',
 'http_version',
 'method',
 'multipart_form',
 'path',
 'raw_content',
 ...
 'wrap']

We can use the mitmproxy export utilities to transform mitm flows to other formats.

In [32]: flow = next(reader.stream())

In [33]: from mitmproxy.addons import export

In [34]: export.curl_command(flow)
Out[34]: "curl -H 'Host:mitm.it' -H 'Proxy-Connection:keep-alive' -H 'User-Agent:Mozilla/5.0 (X11; Linux x86_64) AppleWebKit/537.36 (KHTML, like Gecko) Chrome/67.0.3396.99 Safari/537.36' -H 'DNT:1' -H 'Accept:image/webp,image/apng,image/*,*/*;q=0.8' -H 'Referer:http://mitm.it/' -H 'Accept-Encoding:gzip, deflate' -H 'Accept-Language:en-US,en;q=0.9,ms;q=0.8,te;q=0.7' -H 'content-length:0' 'http://mitm.it/favicon.ico'"

In [35]: export.raw(flow)
Out[35]: b'GET /favicon.ico HTTP/1.1\r\nHost: mitm.it\r\nProxy-Connection: keep-alive\r\nUser-Agent: Mozilla/5.0 (X11; Linux x86_64) AppleWebKit/537.36 (KHTML, like Gecko) Chrome/67.0.3396.99 Safari/537.36\r\nDNT: 1\r\nAccept: image/webp,image/apng,image/*,*/*;q=0.8\r\nReferer: http://mitm.it/\r\nAccept-Encoding: gzip, deflate\r\nAccept-Language: en-US,en;q=0.9,ms;q=0.8,te;q=0.7\r\n\r\n'

In [36]: export.httpie_command(flow)
Out[36]: "http GET http://mitm.it/favicon.ico 'Host:mitm.it' 'Proxy-Connection:keep-alive' 'User-Agent:Mozilla/5.0 (X11; Linux x86_64) AppleWebKit/537.36 (KHTML, like Gecko) Chrome/67.0.3396.99 Safari/537.36' 'DNT:1' 'Accept:image/webp,image/apng,image/*,*/*;q=0.8' 'Referer:http://mitm.it/' 'Accept-Encoding:gzip, deflate' 'Accept-Language:en-US,en;q=0.9,ms;q=0.8,te;q=0.7' 'content-length:0'"

With these utilities we can transform mitmproxy request flow to curl command or any other custom form to fit our needs.

Linux Performance Analysis In Less Than 10 Seconds

If you are using a Linux System or managing a Linux server, you might come across a situation where a process is taking too long to complete. In this article we will see how to track down such performance issues in Linux.

Netflix TechBlog has an article on how to anlyze Linux performance in 60 seconds. This article provides 10+ tools to use in order to see the resource usage and pinpoint the bottleneck.

It is strenuous to remember all those tools/options and laborious to run all those commands when working on multiple systems.

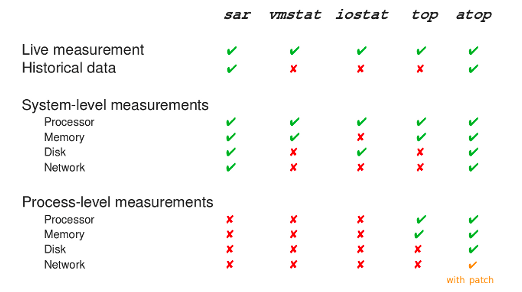
Instead, we can use atop, a tool for one stop solution for performance analysis. Here is a comparision of atop with other tools from LWN.

atop shows live & historical data measurement at system level as well as process level. To get the glimpse of system resource(CPU, memory, network, disk) usage install and run atop with

$ sudo apt install --yes atop

$ atop

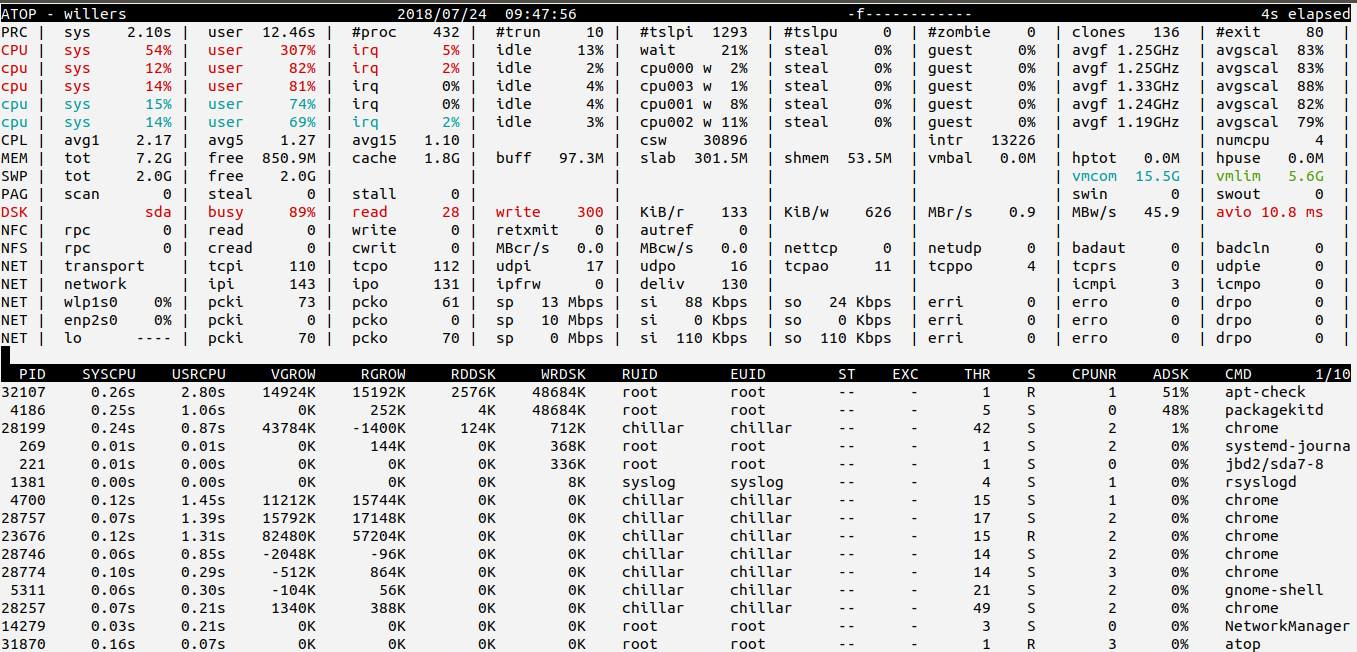
By default, atop shows resources used in the last interval only and sorts them by CPU usage. We can use

$ atop -A -f 4

-A sorts the processes automatically in the order of the most busy system resource.

-f shows both active as well as inactive system resources in the ouput.

4 sets refresh interval to 4 seconds.

Just by looking at the output of atop, we get a glimpse of overall system resource usage as well as individual processes resource usage.

Django Tips & Tricks #10 - Log SQL Queries To Console

Django ORM makes easy to interact with database. To understand what is happening behing the scenes or to see SQL performance, we can log all the SQL queries that be being executed. In this article, we will see various ways to achieve this.

Using debug-toolbar

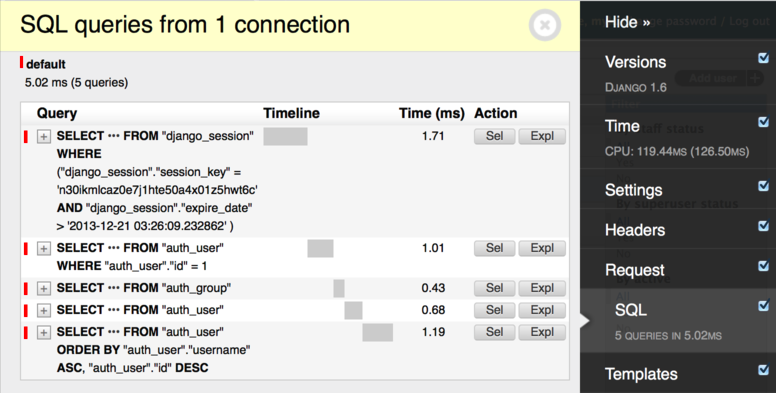
Django debug toolbar provides panels to show debug information about requests. It has SQL panel which shows all executed SQL queries and time taken for them.

When building REST APIs or micro services where django templating engine is not used, this method won't work. In these situations, we have to log SQL queries to console.

Using django-extensions

Django-extensions provides lot of utilities for productive development. For runserver_plus and shell_plus commands, it accepts and optional --print-sql argument, which prints all the SQL queries that are being executed.

./manage.py runserver_plus --print-sql
./manage.py shell_plus --print-sql

Whenever an SQL query gets executed, it prints the query and time taken for it in console.

In [42]: User.objects.filter(is_staff=True)
Out[42]: SELECT "auth_user"."id",
       "auth_user"."password",
       "auth_user"."last_login",
       "auth_user"."is_superuser",
       "auth_user"."username",
       "auth_user"."first_name",
       "auth_user"."last_name",
       "auth_user"."email",
       "auth_user"."is_staff",
       "auth_user"."is_active",
       "auth_user"."date_joined"
  FROM "auth_user"
 WHERE "auth_user"."is_staff" = true
 LIMIT 21


Execution time: 0.002107s [Database: default]

<QuerySet [<User: anand>, <User: chillar>]>

Using django-querycount

Django-querycount provides a middleware to show SQL query count and show duplicate queries on console.

|------|-----------|----------|----------|----------|------------|
| Type | Database  |   Reads  |  Writes  |  Totals  | Duplicates |
|------|-----------|----------|----------|----------|------------|
| RESP |  default  |    3     |    0     |    3     |     1      |
|------|-----------|----------|----------|----------|------------|
Total queries: 3 in 1.7738s


Repeated 1 times.
SELECT "django_session"."session_key",
"django_session"."session_data", "django_session"."expire_date" FROM
"django_session" WHERE ("django_session"."session_key" =
'dummy_key AND "django_session"."expire_date"
> '2018-05-31T09:38:56.369469+00:00'::timestamptz)

This package provides additional settings to customize output.

Django logging

Instead of using any 3rd party package, we can use django.db.backends logger to print all the SQL queries.

Add django.db.backends to loggers list and set log level and handlers.

    'loggers': {
        'django.db.backends': {
            'level': 'DEBUG',
            'handlers': ['console', ],
        },

In runserver console, we can see all SQL queries that are being executed.

(0.001) SELECT "django_admin_log"."id", "django_admin_log"."action_time", "django_admin_log"."user_id", "django_admin_log"."content_type_id", "django_admin_log"."object_id", "django_admin_log"."object_repr", "django_admin_log"."action_flag", "django_admin_log"."change_message", "auth_user"."id", "auth_user"."password", "auth_user"."last_login", "auth_user"."is_superuser", "auth_user"."username", "auth_user"."first_name", "auth_user"."last_name", "auth_user"."email", "auth_user"."is_staff", "auth_user"."is_active", "auth_user"."date_joined", "django_content_type"."id", "django_content_type"."app_label", "django_content_type"."model" FROM "django_admin_log" INNER JOIN "auth_user" ON ("django_admin_log"."user_id" = "auth_user"."id") LEFT OUTER JOIN "django_content_type" ON ("django_admin_log"."content_type_id" = "django_content_type"."id") WHERE "django_admin_log"."user_id" = 4 ORDER BY "django_admin_log"."action_time" DESC LIMIT 10; args=(4,)
[2018/06/03 15:06:59] HTTP GET /admin/ 200 [1.69, 127.0.0.1:47734]

These are few ways to log all SQL queries to console. We can also write a custom middleware for better logging of these queries and get some insights.

How To Deploy Django Channels To Production

In this article, we will see how to deploy django channels to production and how we can scale it to handle more load. We will be using nginx as proxy server, daphne as ASGI server, gunicorn as WSGI server and redis for channel back-end.

Daphne can serve HTTP requests as well as WebSocket requests. For stability and performance, we will use uwsgi/gunicorn to serve HTTP requests and daphne to serve websocket requests.

We will be using systemd to create and manage processes instead of depending on third party process managers like supervisor or circus. We will be using ansible for managing deployments. If you don't want to use ansible, you can just replace template variables in the following files with actual values.

Nginx Setup

Nginx will be routing requests to WSGI server and ASGI server based on URL. Here is nginx configuration for server.

server {
    listen {{ server_name }}:80;
    server_name {{ server_name }} www.{{ server_name }};

    return 301 https://avilpage.com$request_uri;
}


server {
    listen {{ server_name }}:443 ssl;
    server_name {{ server_name }} www.{{ server_name }};

    ssl_certificate     /root/certs/avilpage.com.chain.crt;
    ssl_certificate_key /root/certs/avilpage.com.key;

    access_log /var/log/nginx/avilpage.com.access.log;
    error_log /var/log/nginx/avilpage.com.error.log;

    location / {
            proxy_pass http://0.0.0.0:8000;
            proxy_set_header X-Forwarded-For $proxy_add_x_forwarded_for;
            proxy_set_header Host $http_host;
            proxy_set_header X-Real-IP $remote_addr;
            proxy_redirect off;
    }

    location /ws/ {
            proxy_pass http://0.0.0.0:9000;
            proxy_http_version 1.1;

            proxy_read_timeout 86400;
            proxy_redirect     off;

            proxy_set_header Upgrade $http_upgrade;
            proxy_set_header Connection "upgrade";
            proxy_set_header Host $host;
            proxy_set_header X-Real-IP $remote_addr;
            proxy_set_header X-Forwarded-For $proxy_add_x_forwarded_for;
            proxy_set_header X-Forwarded-Host $server_name;
    }

    location /static {
        alias {{ project_root }}/static;
    }

    location  /favicon.ico {
        alias {{ project_root }}//static/img/favicon.ico;
    }

    location  /robots.txt {
        alias {{ project_root }}/static/txt/robots.txt;
    }

}

WSGI Server Setup

We will use gunicorn for wsgi server. We can run gunicorn with

$ gunicorn avilpage.wsgi --bind 0.0.0.0:8000 --log-level error --log-file=- --settings avilpage.production_settings

We can create a systemd unit file to make it as a service.

[Unit]
Description=gunicorn
After=network.target


[Service]
PIDFile=/run/gunicorn/pid
User=root
Group=root
WorkingDirectory={{ project_root }}
Environment="DJANGO_SETTINGS_MODULE={{ project_name }}.production_settings"
ExecStart={{ venv_bin }}/gunicorn {{ project_name}}.wsgi --bind 0.0.0.0:8000 --log-level error --log-file=- --workers 5 --preload


ExecReload=/bin/kill -s HUP $MAINPID
ExecStop=/bin/kill -s TERM $MAINPID
Restart=on-abort
PrivateTmp=true


[Install]
WantedBy=multi-user.target

Whenever server restarts, systemd will automatically start gunicorn service. We can also restart gunicorn manually with

$ sudo service gunicorn restart

ASGI Server Setup

We will use daphne for ASGI server and it can be started with

$ daphne avilpage.asgi:application --bind 0.0.0.0 --port 9000 --verbosity 1

We can create a systemd unit file like the previous one to create a service.

[Unit]
Description=daphne daemon
After=network.target


[Service]
PIDFile=/run/daphne/pid
User=root
Group=root
WorkingDirectory={{ project_root }}
Environment="DJANGO_SETTINGS_MODULE={{ project_name }}.production_settings"
ExecStart={{ venv_bin }}/daphne --bind 0.0.0.0 --port 9000 --verbosity 0 {{project_name}}.asgi:application
ExecReload=/bin/kill -s HUP $MAINPID
ExecStop=/bin/kill -s TERM $MAINPID
Restart=on-abort
PrivateTmp=true


[Install]
WantedBy=multi-user.target

Deployment

Here is an ansible playbook which is used to deploy these config files to our server. To run the playbook on server avilpage.com, execute

$ ansible-playbook -i avilpage.com, django_setup.yml

Scaling

Now that we have deployed channels to production, we can do performance test to see how our server performs under load.

For WebSockets, we can use Thor to run performance test.

thor -C 100 -A 1000 wss://avilpage.com/ws/books/

Our server is able to handle 100 requests per second with a latency of 800ms. This is good enough for low traffic website.

To improve performance, we can use unix sockets instead of rip/port for gunicorn and daphne. Also, daphne has support for multiprocessing using shared file descriptors. Unfortunately, it doesn't work as expected. As mentioned here, we can use systemd templates and spawn multiple daphne process.

An alternate way is to use uvicorn to start multiple workers. Install uvicorn using pip

$ pip install uvicorn

Start uvicorn ASGI server with

$ uvicorn avilpage.asgi --log-level critical --workers 4

This will spin up 4 workers which should be able to handle more load. If this performance is not sufficient, we have to setup a load balancer and spin up multiple servers(just like scaling any other web application).

Reliable Way To Test External APIs Without Mocking

Let us write a function which retrieves user information from GitHub API.

import requests


def get_github_user_info(username):
    url = f'https://api.github.com/users/{username}'
    response = requests.get(url)
    if response.ok:
        return response.json()
    else:
        return None

To test this function, we can write a test case to call the external API and check if it is returning valid data.

def test_get_github_user_info():
    username = 'ChillarAnand'
    info = get_github_user_info(username)
    assert info is not None
    assert username == info['login']

Even though this test case is reliable, this won't be efficient when we have many APIs to test as it sends unwanted requests to external API and makes tests slower due to I/O.

A widely used solution to avoid external API calls is mocking. Instead of getting the response from external API, use a mock object which returns similar data.

from unittest import mock


def test_get_github_user_info_with_mock():
    with mock.patch('requests.get') as mock_get:
        username = 'ChillarAnand'

        mock_get.return_value.ok = True
        json_response = {"login": username}
        mock_get.return_value.json.return_value = json_response

        info = get_github_user_info(username)

        assert info is not None
        assert username == info['login']

This solves above problems but creates additional problems.

  • Unreliable. Even though test cases pass, we are not sure if API is up and is returning a valid response.
  • Maintenance. We need to ensure mock responses are up to date with API.

To avoid this, we can cache the responses using requests-cache.

import requests_cache

requests_cache.install_cache('github_cache')


def test_get_github_user_info_without_mock():
    username = 'ChillarAnand'
    info = get_github_user_info(username)
    assert info is not None
    assert username == info['login']

When running tests from developer machine, it will call the API for the first time and uses the cached response for subsequent API calls. On CI pipeline, it will hit the external API as there won't be any cache.

When the response from external API changes, we need to invalidate the cache. Even if we miss cache invalidation, test cases will fail in CI pipeline before going into production.

Convert Browser Requests To Python Requests For Scraping

Scraping content behind a login page is bit difficult as there are wide variety of authentication mechanisms and web server needs correct headers, session, cookies to authenticate the request.

If we need a crawler which runs everyday to scrape content, then we have to implement authentication mechanism. If we need to quickly scrape content just for once, implementing authentication is an overhead.

Instead, we can manually login to the website, capture an authenticated request and use it for scraping other pages by changing url/form parameters.

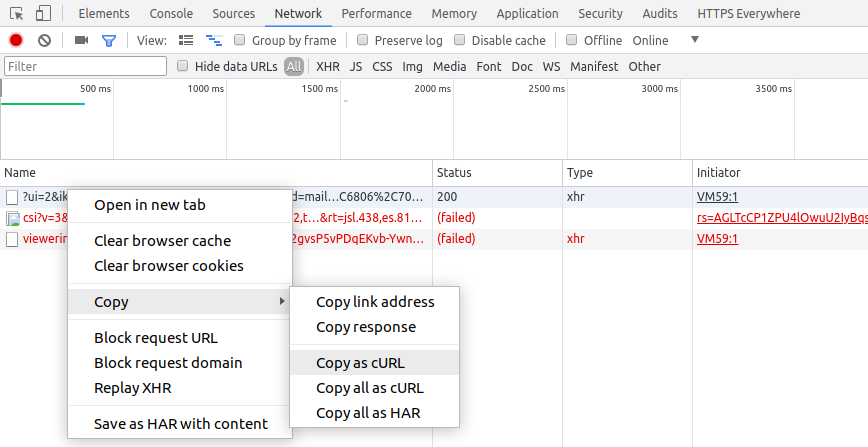
From browser developer options, we can capture curl equivalent command for any request from Network tab with copy as cURL option.

Here is one such request.

curl 'http://avilpage.com/dummy' -H 'Cookie: ASPSESSIONIDSABAAQDA=FKOHHAGAFODIIGNNNDFKNGLM' -H 'Origin: http://avilpage.com' -H 'Accept-Encoding: gzip, deflate' -H 'Accept-Language: en-US,en;q=0.9,ms;q=0.8,te;q=0.7' -H 'Upgrade-Insecure-Requests: 1' -H 'User-Agent: Mozilla/5.0 (X11; Linux x86_64) AppleWebKit/537.36 (KHTML, like Gecko) Chrome/65.0.3325.181 Safari/537.36' -H 'Content-Type: application/x-www-form-urlencoded' -H 'Accept: text/html,application/xhtml+xml,application/xml;q=0.9,image/webp,image/apng,*/*;q=0.8' -H 'Cache-Control: max-age=0' -H 'Referer: http://avilpage.com/' -H 'Connection: keep-alive' -H 'DNT: 1' --data 'page=2&category=python' --compressed

Once we get curl command, we can directly convert it to python requests using uncurl.

$ pip install uncurl

Since the copied curl request is in clipboard, we can pipe it to uncurl.

$ clipit -c | uncurl

requests.post("http://avilpage.com/dummy",
    data='page=2&category=python',
    headers={
        "Accept": "text/html,application/xhtml+xml,application/xml;q=0.9,image/webp,image/apng,*/*;q=0.8",
        "Accept-Encoding": "gzip, deflate",
        "Accept-Language": "en-US,en;q=0.9,ms;q=0.8,te;q=0.7",
        "Cache-Control": "max-age=0",
        "Content-Type": "application/x-www-form-urlencoded",
        "Origin": "http://avilpage.com",
        "Referer": "http://avilpage.com/",
        "Upgrade-Insecure-Requests": "1",
        "User-Agent": "Mozilla/5.0 (X11; Linux x86_64) AppleWebKit/537.36 (KHTML, like Gecko) Chrome/65.0.3325.181 Safari/537.36"
    },
    cookies={
        "ASPSESSIONIDSABAAQDA": "FKOHHAGAFODIIGNNNDFKNGLM"
    },
)

If we have to use some other programming language, we can use curlconverter to convert curl command to Go or Node.js equivalent code.

Now, we can use this code to get contents of current page and then continue scraping from the urls in it.

Running Django Web Apps On Android Devices

When deploying a django webapp to Linux servers, Nginx/Apache as server, PostgreSQL/MySQL as database are preferred. For this tutorial, we will be using django development server with SQLite database.

First install SSHDroid app on Android. It will start ssh server on port 2222. If android phone is rooted, we can run ssh on port 22.

Now install QPython. This comes bundled with pip, which will install required python packages.

Instead of installing these two apps, we can use Termux, GNURoot Debian or some other app which provides Linux environment in Android. These apps will provide apt package manager, which can install python and openssh-server packages.

I have used django-bookmarks, a simple CRUD app to test this setup. We can use rsync or adb shell to copy django project to android.

rsync -razP django-bookmarks :$USER@$HOST:/data/local/

Now ssh into android, install django and start django server.

$ ssh -v $USER@$HOST
$ python -m pip install django
$ cd /data/local/django-bookmarks
$ python manage.py runvserver

This will start development server on port 8000. To share this webapp with others, we will expose it with serveo.

$ ssh -R 80:localhost:8000 serveo.net

Forwarding HTTP traffic from https://incepro.serveo.net
Press g to start a GUI session and ctrl-c to quit.

Now we can share our django app with anyone.

I have used Moto G4 Plus phone to run this app. I have done a quick load test with Apache Bench.

ab -k -c 50 -n 1000  \
-H "Accept-Encoding: gzip, deflate" \
http://incepro.serveo/list/

It is able to server 15+ requests concurrently with an average response time of 800ms.

We can write a simple shell script or ansible playbook to automate this deployment process and we can host a low traffic website on an android phone if required.

Load Testing Celery With Different Brokers

Celery is mainly used to offload work from request/response cycle in web applications and to build pipelines in data processing applications. Lets run a load test on celery to see how well it queues the tasks with various brokers.

Let us take a simple add task and measure queueing time.

import timeit

from celery import Celery

broker = 'memory://'


app = Celery(broker=broker)


@app.task
def add(x, y):
    return x + y


tasks = 1000
start_time = timeit.default_timer()
results = [add.delay(1, 2) for i in range(tasks)]
duration = timeit.default_timer() - start_time
rate = tasks//duration
print("{} tasks/sec".format(str(rate))

On development machine, with AMD A4-5000 CPU, queueing time is as follows

  • memory ---> 400 tasks/sec
  • rabbitmq ---> 300 tasks/sec
  • redis ---> 250 tasks/sec
  • postgres ---> 30 tasks/sec

On production machine, with Intel(R) Xeon(R) CPU E5-2676, queueing time is as follows

  • memory ---> 2000 tasks/sec
  • rabbitmq ---> 1400 tasks/sec
  • redis ---> 1200 tasks/sec
  • postgres ---> 200 tasks/sec

For low/medium traffic webistes and applications, 1000 tasks/second should be fine. For high traffic webistes, there will be multiple servers queueing up the tasks.

Incase if we need to queue the tasks at a higher rate and if we have task arguments before hand, we can chunk the tasks.

tasks = add.chunks(zip(range(1000), range(1000)), 10)

This will divide 1000 tasks into 10 groups of 100 tasks each. As there is no messaging overhead, it can queue any number of tasks in less than a second.