Tips On Writing Data Migrations in Django Application

Introduction

In a Django application, when schema changes Django automatically generates a migration file for the schema changes. We can write additional migrations to change data.

In this article, we will learn some tips on writing data migrations in Django applications.

Use Management Commands

Applications can register custom actions with manage.py by creating a file in management/commands directory of the application. This makes it easy to (re)run and test data migrations.

Here is a management command which migrates the status column of a Task model.

from django.core.management.base import BaseCommand
from library.tasks import Task

class Command(BaseCommand):

    def handle(self, *args, **options):
        status_map = {
            'valid': 'ACTIVE',
            'invalid': 'ERROR',
            'unknown': 'UKNOWN',
        }
        tasks = Task.objects.all()
        for tasks in tasks:
            task.status = status_map[task.status]
            task.save()

If the migration is included in Django migration files directly, we have to rollback and re-apply the entire migration which becomes cubersome.

Link Data Migrations & Schema Migrations

If a data migration needs to happen before/after a specific schema migration, include the migration command using RunPython in the same schema migration or create seperate schema migration file and add schema migration as a dependency.

def run_migrate_task_status(apps, schema_editor):
    from library.core.management.commands import migrate_task_status
    cmd = migrate_task_status.Command()
    cmd.handle()


class Migration(migrations.Migration):

    dependencies = [
    ]

    operations = [
        migrations.RunPython(run_migrate_task_status, RunSQL.noop),
    ]

Watch Out For DB Queries

When working on a major feature that involves a series of migrations, we have to be careful with data migrations(which use ORM) coming in between schema migrations.

For example, if we write a data migration script and then make schema changes to the same table in one go, then the migration script fails as Django ORM will be in invalid state for that data migration.

To overcome this, we can explicitly select only required fields and process them while ignoring all other fields.

# instead of
User.objects.all()

# use
User.objects.only('id', 'is_active')

As an alternative, we can use raw SQL queries for data migrations.

Conclusion

In this article, we have seen some of the problems which occur during data migrations in Django applications and tips to alleviate them.

Profiling & Optimizing Bottlenecks In Django

In the previous article, we have learnt where to start with performance optimization in django application and find out which APIs to optimize first. In this article, we will learn how to optimize those selected APIs from the application.

Profling APIs With django-silk

django-silk provides silk_profile function which can be used to profile selected view or a snippet of code. Let's take a slow view to profile and see the results.

from silk.profiling.profiler import silk_profile


@silk_profile()
def slow_api(request):
    time.sleep(2)
    return JsonResponse({'data': 'slow_response'})

We need to add relevant silk settings to django settings so that required profile data files are generated and stored in specified locations.

SILKY_PYTHON_PROFILER = True
SILKY_PYTHON_PROFILER_BINARY = True
SILKY_PYTHON_PROFILER_RESULT_PATH = '/tmp/'

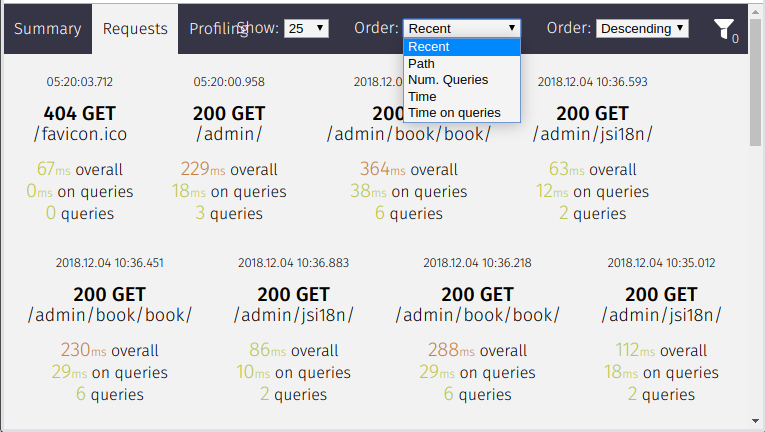
Once the above view is loaded, we can see the profile information in silk profiling page.

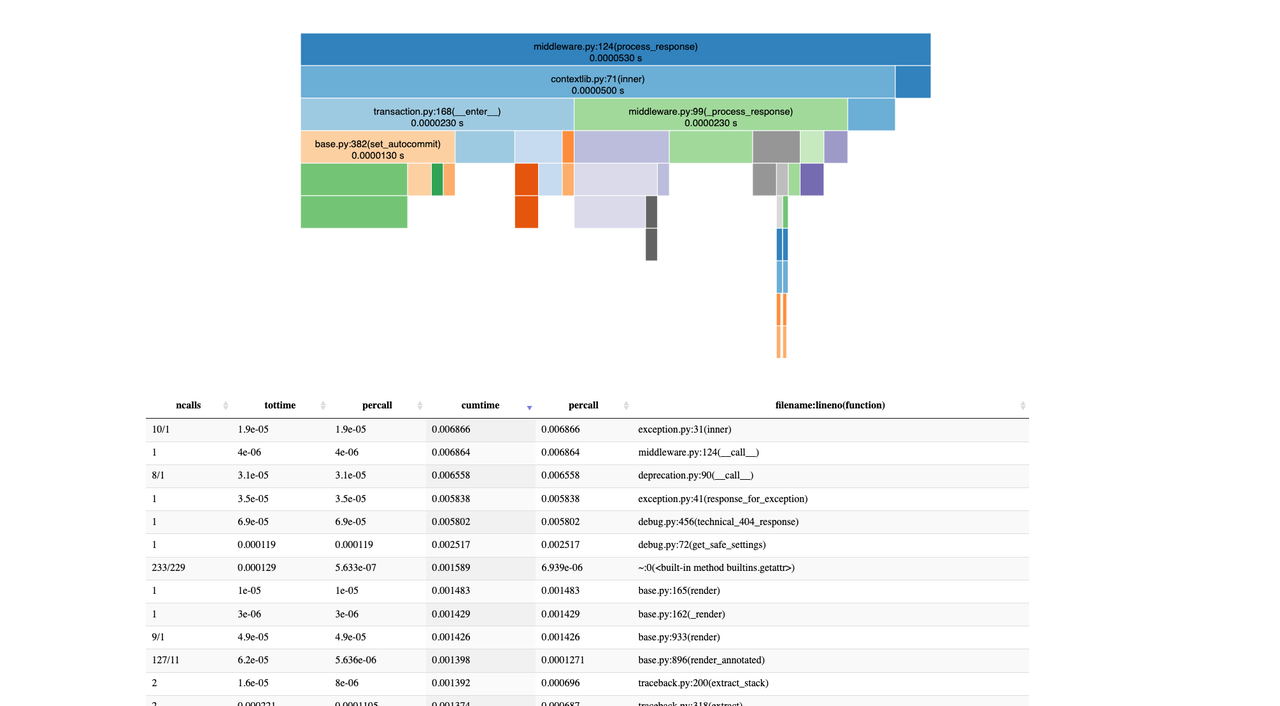
In profile page, silk shows a profile graph and highlights the path where more time is taken.

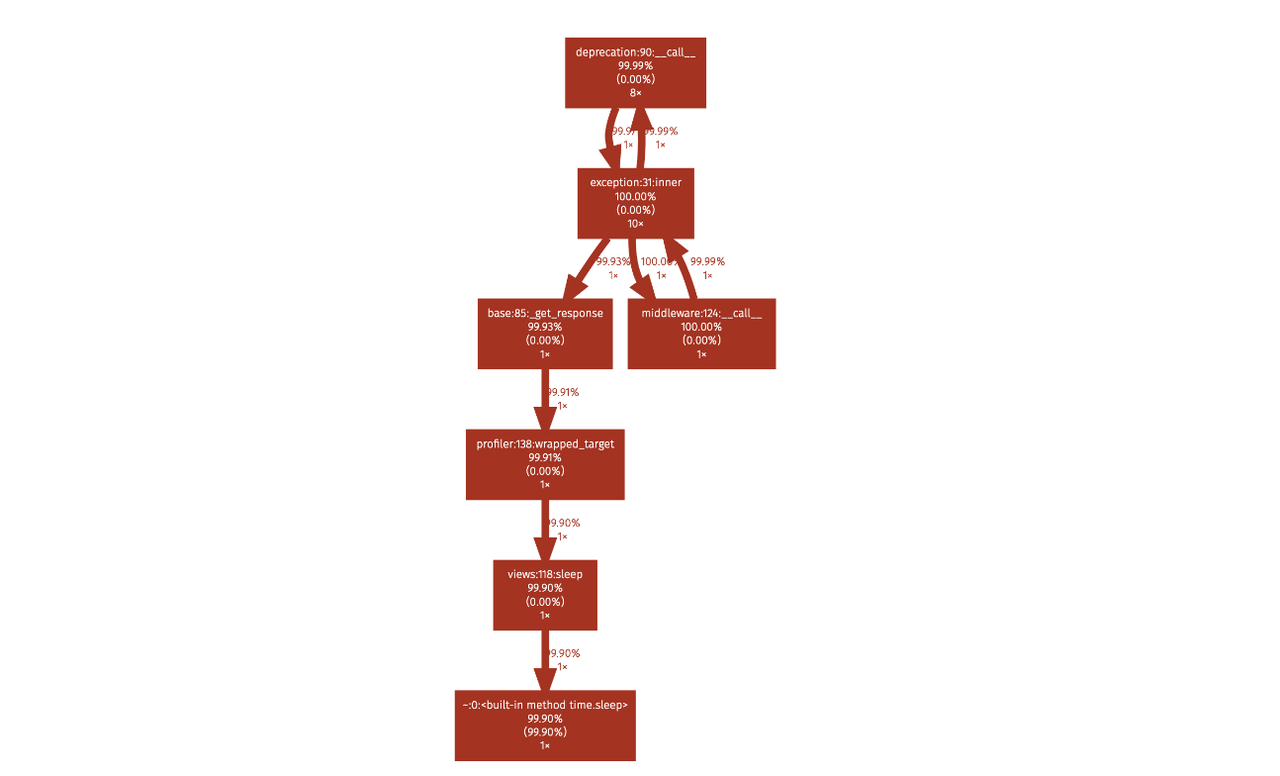
It also shows cprofile stats in the same page. This profile data file can be downloaded and used with other visualization tools like snakeviz.

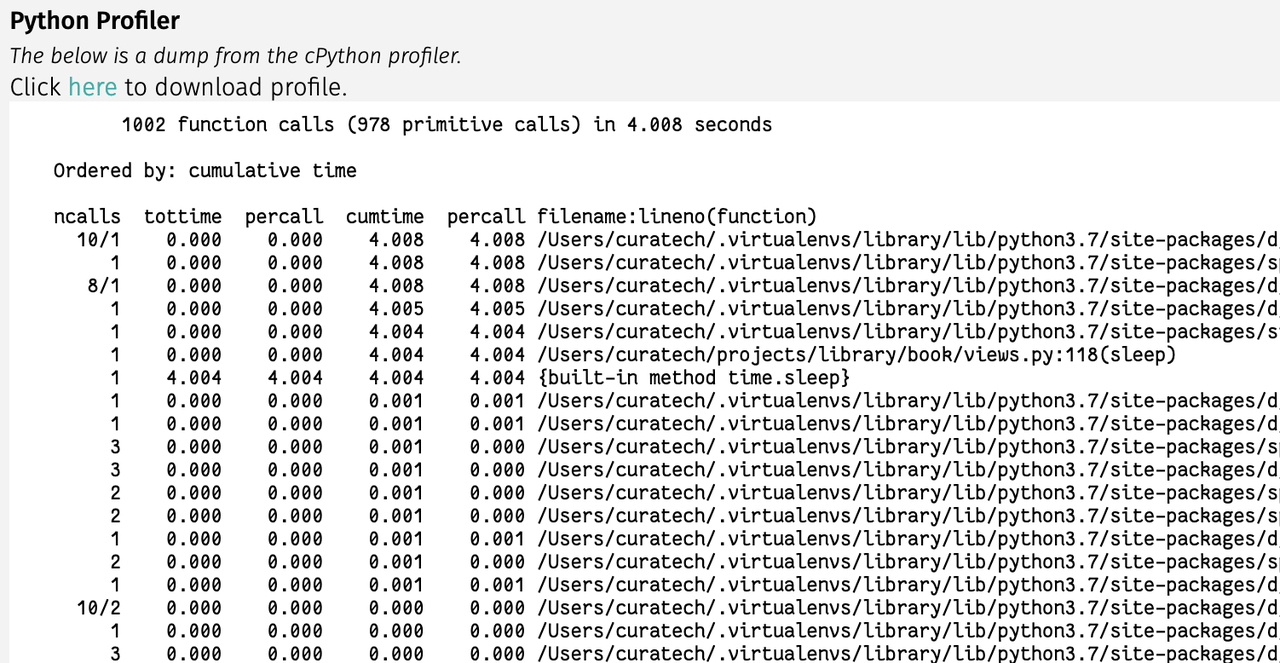
By looking at the above data, we can see most of the time is spent is time.sleep in our view.

Profling APIs With django-extensions

If you don't want to use silk, an alternate way to profile django views is to use runprofileserver command provided by django-extensions package. Install django-extensions package and then start server with the following command.

$ ./manage.py runprofileserver --use-cprofile --nostatic --prof-path /tmp/prof/

This command starts runserver with profiling tools enabled. For each request made to the server, it will save a corresponding .prof profile data file in /tmp/prof/ folder.

After profile data is generated, we can use profile data viewing tools like snakeviz, cprofilev visualize or browse the profile data.

Install snakeviz using pip

$ pip install snakeviz

Open the profile data file using snakeviz.

$ snakeviz /tmp/prof/api.book.list.4212ms.1566922008.prof

It shows icicles graph view and table view of profile data of that view.

These will help to pinpoint which line of code is slowing down the view. Once it is identified, we can take appropriate action like optimize that code, setting up a cache or moving it to a task queue if it is not required to be performed in the request-response cycle.

Versioning & Retrieving Files From AWS S3 With Boto

Introduction

Amazon S3 (Amazon Simple Storage Service) is an object storage service offered by Amazon Web Services. For S3 buckets, if versioning is enabled, users can preserve, retrieve, and restore every version of the object stored in the bucket.

In this article, we will understand how to enable versioning for a bucket and retrieve all versions of an object from AWS web interface as well as Python boto library.

Versioning of Bucket

Bucket versioning can be changed with a toggle button from the AWS web console in the bucket properties.

We can do the same with Python boto3 library.

import boto3


bucket_name = 'avilpage'

s3 = boto3.resource('s3')
versioning = s3.BucketVersioning(bucket_name)

# check status
print(versioning.status)

# enable versioning
versioning.enable()

# disable versioning
versioning.suspend()

Retrieving Objects

Once versioning is enabled, we can store multiple versions of an object by uploading an object multiple times with the same key.

We can write a simple script to generate a text file with a random text and upload it to S3.

import random
import string

import boto3

file_name = 'test.txt'
key = file_name
s3 = boto3.client('s3')

with open(file_name, 'w') as fh:
    data = ''.join(random.choice(string.ascii_letters) for _ in range(10))
    fh.write(data)

s3.upload_file(key, bucket_name, file_name)

If this script is executed multiple times, the same file gets overridden with a different version id with the same key in the bucket.

We can see all the versions of the file from the bucket by selecting the file and then clicking drop-down at Latest version.

We can write a script to retrieve and show contents of all the versions of the test.txt file with the following script.

import boto3


bucket_name = 'avilpage'
s3_client = boto3.client('s3')

versions = s3_client.list_object_versions(Bucket=bucket_name)

for version in versions:
    version_id = versions['Versions'][0]['VersionId']
    file_key = versions['Versions'][0]['Key']

    response = s3.get_object(
        Bucket=bucket_name,
        Key=file_key,
        VersionId=version_id,
    )
    data = response['Body'].read()
    print(data)

Conclusion

Object versioning is useful to protect data from unintended overwrites. In this article, we learnt how to change bucket versioning, upload multiple versions of same file and retrieving all versions of the file using AWS web console as well as boto3.

Why My Grandma Can Recall 100+ Phone Numbers, But We Can't

On a leisure evening, as I was chit chatting with my grandma, my phone started ringing. Some one who is not in my contacts is calling me. As I was wondering who the heck is calling, my grandma just glanced at my screen and said, "Its you uncle Somu, pick up the phone". I was dumbstruck by this.

Later that evening, I asked my grandma to recall the phone numbers she remembers. She recalled 30+ phone numbers and she was able to recognize 100+ phone numbers based on the last 4 digits of the mobile.

That came as a surprise for me as I don't even remember 10+ phone numbers now. Most of the smart phone users don't remember family and friends phone numbers anymore.

A decade back, I used to remember most of my relatives and friends phone numbers even though I didn't had a phone. My grandma used to use a mini notebook to write all the phone numbers. I was worried about this mini notebook as it can get lost easily and it is always hard to find when required.

Since my grandma didn't have any contacts in her phone, she gets a glimpse of number every time someone calls her. She also dials the number every time she has to call someone. With this habit she is able to memorize all the numbers.

I, on the other hand started using a smart phone which has all the contacts. I search my contacts by name when I have to dial someone and there is no need to dial the number. Also whenever someone call me, their name gets displayed in large letters and I never get to focus on the number. Due to this, I don't remember any of the phone numbers

After this revelation, I started an experiment by disabling contact permissions for dialer app. With this, I am forced to type the number or select appropriate number from the call history and dial it. This was a bit uncomfortable at first. Soon I got used to it as recognized more and more numbers.

This might seem unnecessary in the smart phone age. But when you are traveling or when your phone gets switched off, it's hard to contact people. Even if someone gives their phone, it is of no use if I don't remember any numbers.

Also it is important to remember phone numbers of family and friends which might be needed in case of emergencies.

Switching Hosts With Bookmarklets - Web Development Tips

When debugging an issue related to web development projects, which is inconsistent between environments (local, development, QA, staging and production), we have to frequently switch between them.

If we are debugging something on the home page, then we can just bookmark the host URLs. We can switch between them by clicking on the relevant bookmark. Some browsers provide autocompletion for bookmarks. So we can type a few characters and then select the relevant URL from suggestions.

When debugging an issue on some other page like https://avilpage.com/validate/books/?name=darwin&year=2019, which has URL path and query param, switching between enviroment becomes tedious. To switch to local environment, we have to manually replace the hostname with localhost.

To avoid this, we can use a bookmarklet to switch the hosts. A bookmarklet is a bookmark which contains a JavaScript code snippet in its URL. This code snippet will be executed when the bookmarklet is clicked.

Lets create a bookmarklet to replace host in the URL with http://localhost:8000. Create new bookmark called To Local and in the URL add the following snippet.

javascript:(function() { window.location.replace("http://localhost:8000" + window.location.pathname + window.location.search); }())

If we click on To Local bookmarklet, it will redirect the current active page to localhost URL.

We can create one more bookmarklet to switch to production. Create a bookmarklet called To Production and add the following snippet in the URL.

javascript:(function() { window.location.replace("http://avilpage.com" + window.location.pathname + window.location.search); }())

We can create similar bookmarklets to switch to other environments. Now, switching between environments on any page is as easy as clicking a button.

A Short Guide To Debugging PostgreSQL Triggers

Introduction

PostgreSQL triggers will associate a function to a table for an event. If multiple triggers of the same kind are defined for the same event, they will be executed in alphabetical order by name.

In this article, we will see how to debug PostgreSQL triggers.

Triggers

First, ensure triggers are enabled on the required tables for INSERT/UPDATE/DELETE events. We can check available triggers by running the following query.

SELECT * FROM information_schema.triggers;

We can also use EXPLAIN to show triggers that are executed for an event by running relevant queries.

PostgreSQL Logging

After ensuring triggers are applied correctly, set the logging level for postgresql server and client in postgres.conf file.

# let the server log all queries
log_statement = 'all'

# set client message to log level
client_min_messages = log

Restart PostgreSQL to reflect configuration changes.

# Linux
sudo service postgres restart

# Mac
brew services restart postgres

Tail the logs and check if queries are executing correctly with appropriate values.

Triggers Logging

After enabling logging for PostgreSQL, we can raise messages/errors in triggers so that we can see if any unexpected things are happening at any point in the trigger.

RAISE 'Updating row with ID: %', id;
RAISE division_by_zero;
RAISE WARNING 'Unable to delete record';

This ensures triggers are executing as expected and if there are any warnings/errors, it will log a message.

SQL/PostgreSQL Gotchas

Even though queries and triggers are executing correctly, we might not see the desired result because of the potentially surprising behavior of PostgreSQL. There are some scenarios where PostgreSQL seems to be not working at first but it actually is the expected behavior.

  1. Unquoted object names will be treated as lowercase. SELECT FOO FROM bar will become SELECT foo FROM bar.
  2. Comparing nullable fields. This might yield strange results as NULL != NULL.
  3. PostgreSQL uses POSIX offsets. For 04:21:42 UTC+01, +1 means the timezone is west of Greenwich.

Conclusion

By being aware of common PostgreSQL gotchas and enabling logging for PostgreSQL clients, servers & triggers, pinpointing the bug in triggers becomes easy. Once the bug is identified, appropriate action can be taken to fix the issue.

Essential PyCharm (Intellij) Plugins To Improve Productivity

As per 2019 JetBrains survery, PyCharm is the most widely used(36%) IDE for Python development. Even though PyCharm comes with a lot of built-in features, there are a lot of plugins available for PyCharm and other Intellij IDEs. In this article, we will see some plugins which will boost our productivity during development.

Ace Jump

To move caret to a particular position in the editor without mouse, AceJump plugin will be useful. It allows to quickly navigate the caret to any position in the editor.

GitToolBox

GitToolBox provides a lot of additional features like inblame support, status bar widget, commit dialog, branch name completion, etc.

Grep Console

When running a django/flask server or any Python script which generates a lot of output, it is hard to filter specific output on console. Grep Console can filter or highlight output based on specific conditions which makes it easier to debug the code.

Highlight Bracket Pair

Instead of manually scanning where a bracket starts/ends, Highlight Bracket Pair will automatically highlight the bracket pairs based on cursor position.

Key Promoter

If you are new to PyCharm or an experienced user who is using mouse instead of key board shortcuts, Key Promoter will show relevant key board shortcut when mouse is used inside IDE. This provides an easy way to learn keyboard shortcuts faster.

Rainbow Brackets

Highlight Bracket Pair will hightlight the bracket pair around the cursor. When there are multiple bracket pairs deeply nested, Rainbow Brackets will highlight matching bracket pairs with matching rainbow colors.

Save Actions

Instead of manually optimizing imports or reformatting code when changes are made, we can use Save Actions which will automatically run a set of actions on every file save.

String Manipulation

To convert lower case letters to upper case letter, String manipulation plugin will be useful. In addition to lower/upper case conversion, it also provides options to convert to cameCase, kebab-case, PascalCase etc.

These are some plugins which will boost developers productivity while writing and debugging code in PyCharm or other JetBrains IDE.

Django Tips & Tricks #12 - Automatically Set CSRF Token in Postman

Introduction

Django has inbuilt CSRF protection mechanism for requests via unsafe methods to prevent Cross Site Request Forgeries. When CSRF protection is enabled on AJAX POST methods, X-CSRFToken header should be sent in the request.

Postman is one of the widely used tool for testing APIs. In this article, we will see how to set csrf token and update it automatically in Postman.

CSRF Token In Postman

Django sets csrftoken cookie on login. After logging in, we can see the csrf token from cookies in the Postman.

We can grab this token and set it in headers manually.

But this token has to be manually changed when it expires. This process becomes tedious to do it on an expiration basis.

Instead, we can use Postman scripting feature to extract token from cookie and set it to an environment variable. In Test section of postman, add these lines.

var xsrfCookie = postman.getResponseCookie("csrftoken");
postman.setEnvironmentVariable('csrftoken', xsrfCookie.value);

This extracts csrf token and sets it to an environment variable called csrftoken in the current environment.

Now in our requests, we can use this variable to set the header.

When the token expires, we just need to login again and csrf token gets updated automatically.

Conclusion

In this article we have seen how to set and renew csrftoken automatically in Postman. We can follow similar techniques on other API clients like CURL or httpie to set csrf token.

How To Install Private Python Packages With Pip

Introduction

To distribute python code, we need to package it and host it somewhere, so that users can install and use it. If the code is public, it can be published to PyPi or any public repository, so that anyone can access it. If the code is private, we need to provide proper authentication mechanism before allowing users to access it.

In this article, we will see how to use pip to install Python packages hosted on GitLab, GitHub, Bitbucket or any other services.

Packaging

To package python project, we need to create setup.py file which is build script for setuptools. Below is a sample setup file to create a package named library.

import setuptools


with open("README.md", "r") as fh:
    long_description = fh.read()

setuptools.setup(
    name="library",
    version="0.0.1",
    author="chillaranand",
    author_email="foo@avilpage.com",
    description="A simple python package",
    long_description=long_description,
    url="https://github.com/chillaranand/library",
    packages=setuptools.find_packages(),
    classifiers=[
        "Programming Language :: Python :: 3",
        "License :: OSI Approved :: MIT License",
        "Operating System :: OS Independent",
    ],
)

Python provides detailed packaging documentation on structuring and building the package.

Installation

Once module(s) is packaged and pushed to hosting service, it can be installed with pip.

# using https
$ pip install git+https://github.com/chillaranand/library.git

# using ssh
pip install git+ssh://git@github.com/chillaranand/library.git

This usually requires authentication with usersname/password or ssh key. This setup works for developement machines. To use it in CI/CD pipelines or as a dependency, we can use tokens to simplify installation.

$ export GITHUB_TOKEN=foobar

$ pip install git+https://$GITHUB_TOKEN@github.com/chillaranand/library.git

Conclusion

In this article, we have seen how to package python code and install private packages with pip. This makes it easy to manage dependencies or install packages on multiple machines.

Find High-impact Performance Bottlenecks in Django

Introduction

When optimizing performance of web application, a common mistake is to start with optimizing the slowest page(or API). In addition to considering response time, we should also consider the traffic it is receving to priorotize the order of optimization.

In this article we will profile a django webapp, find high-impact performance bottlenecks and then start optimization them to yield better performance.

Profiling

django-silk is an open source profiling tool which intercepts and stores HTTP requests data. Install it with pip.

pip install django-silk

Add silk to installed apps and include silk middleware in django settings.

MIDDLEWARE = [
    ...
    'silk.middleware.SilkyMiddleware',
    ...
]

INSTALLED_APPS = (
    ...
    'silk'
)

Run migrations so that Silk can create required database tables to store profile data.

$ python manage.py makemigrations
$ python manage.py migrate
$ python manage.py collectstatic

Include silk urls in root urlconf to view the profile data.

urlpatterns += [url(r'^silk/', include('silk.urls', namespace='silk'))]

On silk requests page(http://host/silk/requests/), we can see all requests and sort them by overall time or time spent in database.

High Impact Bottlenecks

Silk creates silk_request table which contains information about the requests processed by django.

$ pgcli

library> \d silk_request;

+--------------------+--------------------------+-------------+
| Column             | Type                     | Modifiers   |
|--------------------+--------------------------+-------------|
| id                 | character varying(36)    |  not null   |
| path               | character varying(190)   |  not null   |
| time_taken         | double precision         |  not null   |
...

We can group these requests data by path, calculate number of requests, average time taken and impact factor of each path. Since we are considering response time and traffic, impact factor will be product of average response time and number of requests for that path.

library> SELECT
     s.*, round((s.avg_time * s.count)/max(s.avg_time*s.count) over ()::NUMERIC,2) as impact
 FROM
     (select path, round(avg(time_taken)::numeric,2) as avg_time, count(path) as count from silk_request group by PATH)
     s
 ORDER BY impact DESC;

+-------------------------+------------+---------+----------+
| path                    | avg_time   | count   | impact   |
|-------------------------+------------+---------+----------|
| /point/book/book/       | 239.90     | 1400    | 1.00     |
| /point/book/data/       | 94.81      | 1900    | 0.54     |
| /point/                 | 152.49     | 900     | 0.41     |
| /point/login/           | 307.03     | 400     | 0.37     |
| /                       | 106.51     | 1000    | 0.32     |
| /point/auth/user/       | 494.11     | 200     | 0.29     |
...

We can see /point/book/book/ has highest impact even though it is neighter most visited nor slowest view. Optimizing this view first yields in overall better performance of webapp.

Conclusion

In this article, we learnt how to profile django webapp and identify bottlenecks to improve performance. In the next article, we wil learn how to optimize these bottlenecks by taking an in-depth look at them.