Mastering Kraken2 - Part 1 - Initial Runs

Mastering Kraken2

Part 1 - Initial Runs (this post)

Part 2 - Classification Performance Optimisation

Part 3 - Build custom database indices

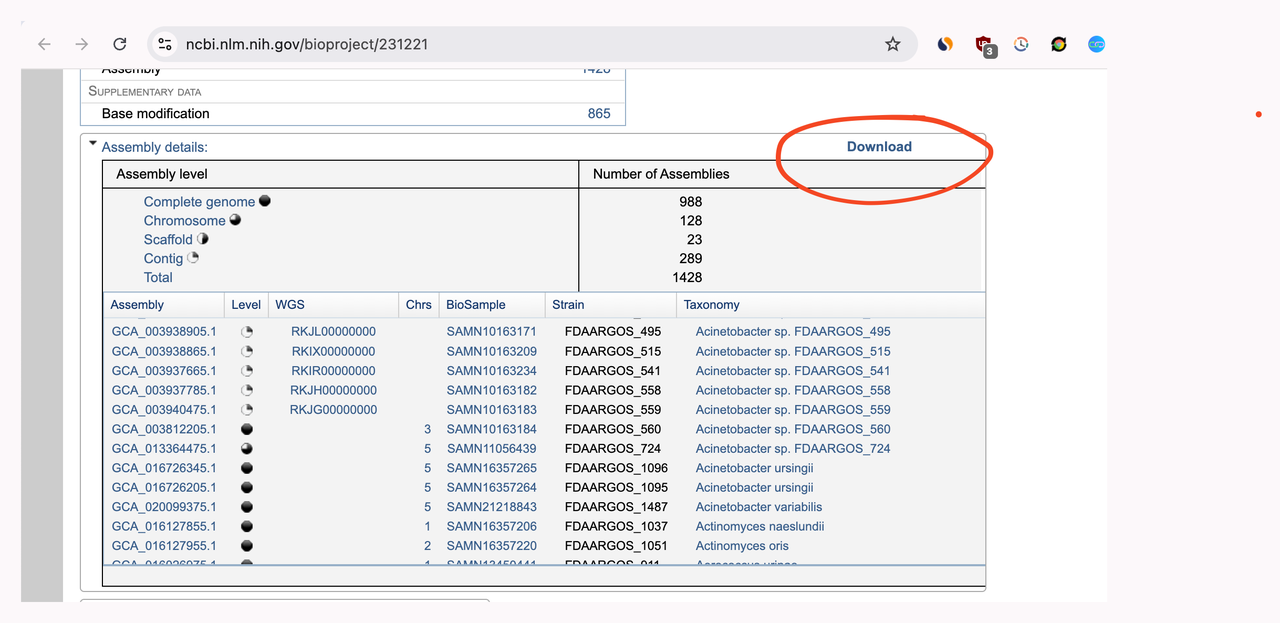
Part 4 - Build FDA-ARGOS index (this post)

Part 5 - Regular vs Fast Builds (upcoming)

Part 6 - Benchmarking (upcoming)

Introduction

Kraken21 is widely used for metagenomics taxonomic classification, and it has pre-built indexes for many organisms. In this series, we will learn

  • How to set up kraken2, download pre-built indices
  • Run kraken2 (8GB RAM) at ~0.19 Mbp/m (million base pairs per minute)
  • Learn various ways to speed up the classification process
  • Run kraken2 (128GB RAM) at ~1200 Mbp/m
  • Build custom indices

Installation

We can install kraken2 from source using the install_kraken2.sh script as per the manual2.

$ git clone https://github.com/DerrickWood/kraken2
$ cd kraken2
$ ./install_kraken2.sh /usr/local/bin
# ensure kraken2 is in the PATH
$ export PATH=$PATH:/usr/local/bin

If you already have conda installed, you can install kraken2 from conda as well.

$ conda install -c bioconda kraken2

If you have brew installed on Linux or Mac(including M1), you can install kraken2 using brew.

$ brew install brewsci/bio/kraken2

Download pre-built indices

Building kraken2 indices take a lot of time and resources. For now, let's download and use the pre-built indices. In the final post, we will learn how to build the indices.

Genomic Index Zone3 provides pre-built indices for kraken2. Let's download the standard database. It contains Refeq archaea, bacteria, viral, plasmid, human1, & UniVec_Core.

$ wget https://genome-idx.s3.amazonaws.com/kraken/k2_standard_20240605.tar.gz
$ mkdir k2_standard
$ tar -xvf k2_standard_20240605.tar.gz -C k2_standard

The extracted directory contains three files - hash.k2d, opts.k2d, taxo.k2d which are the kraken2 database files.

$ ls -l *.k2d
.rw-r--r--  83G anand 13 Jul 12:34 hash.k2d
.rw-r--r--   64 anand 13 Jul 12:34 opts.k2d
.rw-r--r-- 4.0M anand 13 Jul 12:34 taxo.k2d

Classification

To run the taxonomic classification, let's use ERR10359977 human gut meta genome from NCBI SRA.

$ wget https://ftp.sra.ebi.ac.uk/vol1/fastq/ERR103/077/ERR10359977/ERR10359977.fastq.gz
$ kraken2 --db k2_standard --report report.txt ERR10359977.fastq.gz > output.txt

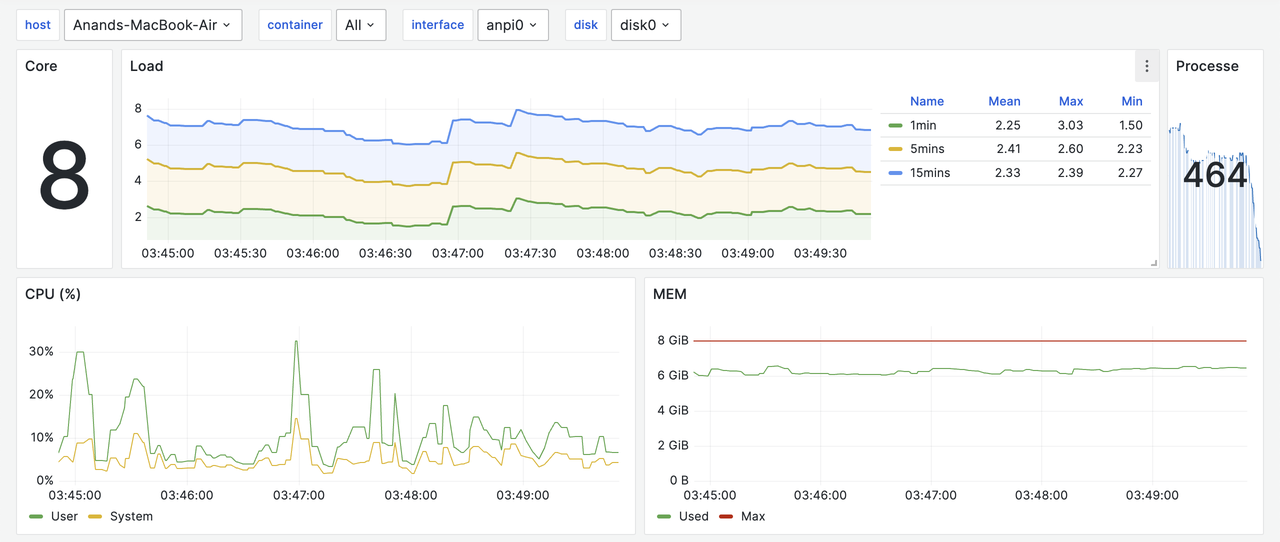
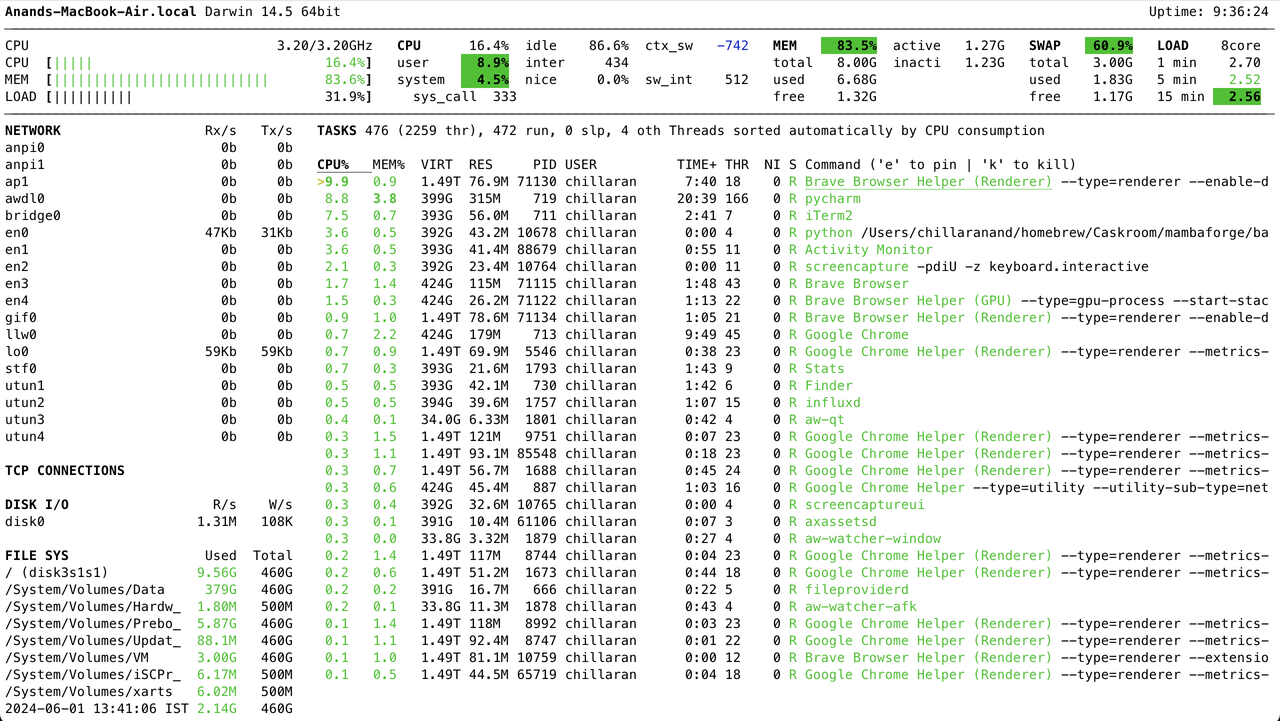
By default, the machine I have used has 8GB RAM and an additioinal 8GB swap. Since kraken2 needs entire db(~80GB) in memory, when the process tries to consume more than 16GB memory, the kernel will kill the process.

$ time kraken2 --db k2_standard --paired SRR6915097_1.fastq.gz SRR6915097_2.fastq.gz > output.txt
Loading database information...Command terminated by signal 9
0.02user 275.83system 8:17.43elapsed 55%CPU 

To prevent this, let's increase the swap space to 128 GB.

# Create an empty swapfile of 128GB
sudo dd if=/dev/zero of=/swapfile bs=1G count=128

# Turn swap off - It might take several minutes
sudo swapoff -a

# Set the permissions for swapfile
sudo chmod 0600 /swapfile

# make it a swap area
sudo mkswap /swapfile  

# Turn the swap on
sudo swapon /swapfile

We can time the classification process using the time command.

$ time kraken2 --db k2_standard --report report.txt ERR10359977.fastq.gz > output.txt

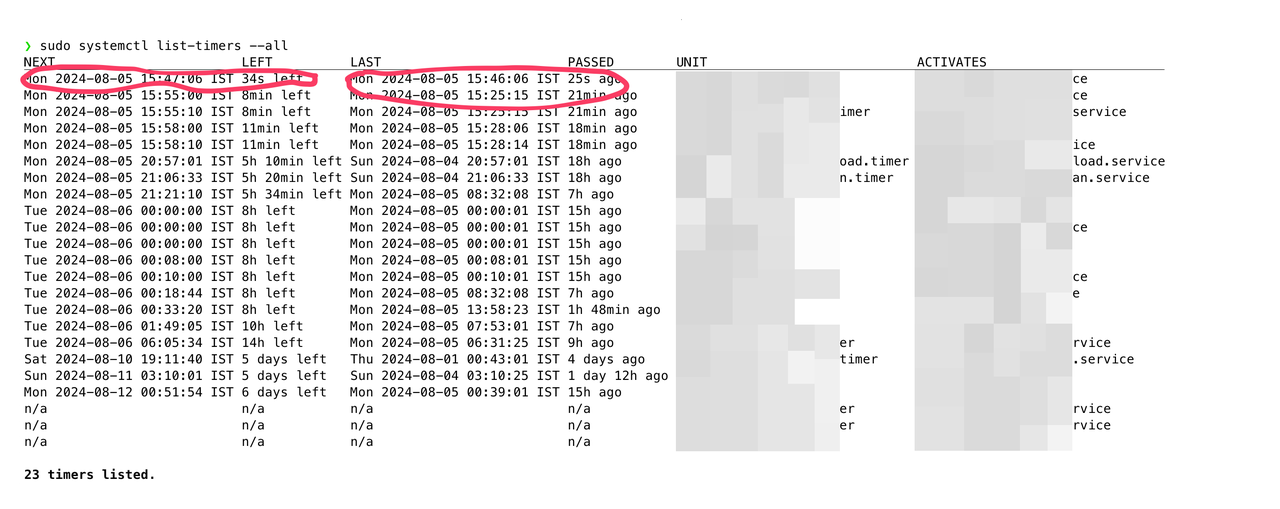
If you have a machine with large RAM, the same scenario can be simulated using systemd-run. This will limit the memory usage of kraken2 to 6.5GB.

$ time systemd-run --scope -p MemoryMax=6.5G --user time kraken2 --db k2_standard --report report.txt ERR10359977.fastq.gz > output.txt

Depending on the CPU performance, this will take around ~40 minutes to complete.

Loading database information... done.
95064 sequences (14.35 Mbp) processed in 1026.994s (5.6 Kseq/m, 0.84 Mbp/m).
  94939 sequences classified (99.87%)
  125 sequences unclassified (0.13%)
  4.24user 658.68system 38:26.78elapsed 28%CPU 

If we try gut WGS(Whole Genome Sequence) sample like SRR6915097 45. which contains ~3.3 Gbp, it will take weeks to complete.

$ wget -c https://ftp.sra.ebi.ac.uk/vol1/fastq/SRR691/007/SRR6915097/SRR6915097_1.fastq.gz
$ wget -c https://ftp.sra.ebi.ac.uk/vol1/fastq/SRR691/007/SRR6915097/SRR6915097_2.fastq.gz

$ time systemd-run --scope -p MemoryMax=6G --user time kraken2 --db k2_standard --paired SRR6915097_1.fastq.gz SRR6915097_2.fastq.gz > output.txt

I tried running this on 8 GB machine. Even after 10 days, it processed only 10% of the data.

If we have to process a large number of such samples, it takes months and this is not a practical solution.

Conclusion

In this post, we ran kraken2 on an 8GB machine and learned that it is not feasible to run kraken2 on large samples.

In the next post, we will learn how to speed up the classification process and run classification at 1200 Mbp/m.

Next: Part 2 - Performance Optimisation

Headlamp - k8s Lens open source alternative

headlamp - Open source Kubernetes Lens alternator

Since Lens is not open source, I tried out monokle, octant, k9s, and headlamp1. Among them, headlamp UI & features are closest to Lens.

Headlamp

Headlamp is CNCF sandbox project that provides cross-platform desktop application to manage Kubernetes clusters. It auto-detects clusters and provides cluster wide resource usage by default.

It can also be installed inside the cluster and can be accessed using a web browser. This is useful when we want to access the cluster from a mobile device.

$ helm repo add headlamp https://headlamp-k8s.github.io/headlamp/

$ helm install headlamp headlamp/headlamp

Lets port-forward the service & copy the token to access it.

$ kubectl create token headlamp

# we can do this via headlamp UI as well
$ kubectl port-forward service/headlamp 8080:80

Now, we can access the headlamp UI at http://localhost:8080.

headlamp - Open source Kubernetes Lens alternator

Conclusion

If you are looking for an open source alternative to Lens, headlamp is a good choice. It provides a similar UI & features as Lens, and it is accessible via mobile devices as well.

macOS - Log & track historical CPU, RAM usage

macOS - Log CPU & RAM history

In macOS, we can use inbuilt Activity Monitor or third party apps like Stats to check the live CPU/RAM usage. But, we can't track the historical CPU & memory usage. sar, atop can track the historical CPU & memory usage. But, they are not available for macOS.

Netdata

Netdata1 is an open source observability tool that can monitor CPU, RAM, network, disk usage. It can also track the historical data.

Unfortunately, it is not stable on macOS. I tried installing it on multiple macbooks, but it didn't work. I raised an issue2 on their GitHub repository and the team mentioned that macOS is a low priority for them.

Glances

Glances3 is a cross-platform monitoring tool that can monitor CPU, RAM, network, disk usage. It can also track the historical data.

We can install it using Brew or pip.

$ brew install glances

$ pip install glances

Once it is installed, we can monitor the resource usage using the below command.

$ glances

macOS - Log CPU & RAM history

Glances can log historical data to a file using the below command.

$ glances --export-csv /tmp/glances.csv

In addition to that, it can log data to services like influxdb, prometheus, etc.

Let's install influxdb and export stats to it.

$ brew install influxdb
$ brew services start influxdb
$ influx setup

$ python -m pip install influxdb-client

$ cat glances.conf
[influxdb]
host=localhost
port=8086
protocol=http
org=avilpage
bucket=glances
token=secret_token

$ glances --export-influxdb -C glances.conf

We can view stats in the influxdb from Data Explorer web UI at http://localhost:8086.

macOS - Log CPU & RAM history

Glances provides a prebuilt Grafana dashboard4 that we can import to visualize the stats.

From Grafana -> Dashboard -> Import, we can import the dashboard using the above URL.

macOS - Log CPU & RAM history

Conclusion

In addition to InfluxDB, Glances can export data to ~20 services. So far, it is the best tool to log, track and view historical CPU, RAM, network and disk usage in macOS. The same method works for Linux and Windows as well.

Automating Zscaler Connectivity on macOS

Introduction

Zscaler is a cloud-based security service that provides secure internet access via VPN. Unfortunately, Zscaler does not provide a command-line interface to connect to the VPN. We can't use AppleScript to automate the connectivity as well.

Automating Zscaler Connectivity

Once Zscaler is installed on macOS, if we search for LaunchAgents & LaunchDaemons directories, we can find the Zscaler plist files.

$ sudo find /Library/LaunchAgents -name '*zscaler*'
/Library/LaunchAgents/com.zscaler.tray.plist


$ sudo find /Library/LaunchDaemons -name '*zscaler*'
/Library/LaunchDaemons/com.zscaler.service.plist
/Library/LaunchDaemons/com.zscaler.tunnel.plist
/Library/LaunchDaemons/com.zscaler.UPMServiceController.plist

To connect to Zscaler, we can load these services.

#!/bin/bash

/usr/bin/open -a /Applications/Zscaler/Zscaler.app --hide
sudo find /Library/LaunchAgents -name '*zscaler*' -exec launchctl load {} \;
sudo find /Library/LaunchDaemons -name '*zscaler*' -exec launchctl load {} \;

To disconnect from Zscaler, we can unload all of them.

#!/bin/bash

sudo find /Library/LaunchAgents -name '*zscaler*' -exec launchctl unload {} \;
sudo find /Library/LaunchDaemons -name '*zscaler*' -exec launchctl unload {} \;

To automatically toggle the connectivity, we can create a shell script.

#!/bin/bash

if [[ $(pgrep -x Zscaler) ]]; then
    echo "Disconnecting from Zscaler"
    sudo find /Library/LaunchAgents -name '*zscaler*' -exec launchctl unload {} \;
    sudo find /Library/LaunchDaemons -name '*zscaler*' -exec launchctl unload {} \;
else
    echo "Connecting to Zscaler"
    /usr/bin/open -a /Applications/Zscaler/Zscaler.app --hide
    sudo find /Library/LaunchAgents -name '*zscaler*' -exec launchctl load {} \;
    sudo find /Library/LaunchDaemons -name '*zscaler*' -exec launchctl load {} \;
fi

Raycast is an alternative to default spotlight search on macOS. We can create a script to toggle connectivity to Zscaler.

#!/bin/bash

# Required parameters:
# @raycast.schemaVersion 1
# @raycast.title toggle zscaler
# @raycast.mode silent

# Optional parameters:
# @raycast.icon ☁️

# Documentation:
# @raycast.author chillaranand
# @raycast.authorURL https://avilpage.com/

if [[ $(pgrep -x Zscaler) ]]; then
    echo "Disconnecting from Zscaler"
    sudo find /Library/LaunchAgents -name '*zscaler*' -exec launchctl unload {} \;
    sudo find /Library/LaunchDaemons -name '*zscaler*' -exec launchctl unload {} \;
else
    echo "Connecting to Zscaler"
    /usr/bin/open -a /Applications/Zscaler/Zscaler.app --hide
    sudo find /Library/LaunchAgents -name '*zscaler*' -exec launchctl load {} \;
    sudo find /Library/LaunchDaemons -name '*zscaler*' -exec launchctl load {} \;
fi

Save this script to a folder. From Raycast Settings -> Extensions -> Add Script Directory, we can select this folder, and the script will be available in Raycast.

raycast-connect-toggle

We can assign a shortcut key to the script for quick access.

raycast-connect-toggle

Conclusion

Even though Zscaler does not provide a command-line interface, we can automate the connectivity using the above scripts.

Screen Time Alerts from Activity Watch

Introduction


Activity Watch1 is a cross-platform open-source time-tracking tool that helps us to track time spent on applications and websites.

Activity Watch

At the moment, Activity Watch doesn't have any feature to show screen time alerts. In this post, we will see how to show screen time alerts using Activity Watch.

Python Script

Activity Watch provides an API to interact with the Activity Watch server. We can use the API to get the screen time data and show alerts.

import json
import os
from datetime import datetime

import requests


def get_nonafk_events(timeperiods=None):
    headers = {"Content-type": "application/json", "charset": "utf-8"}
    query = """afk_events = query_bucket(find_bucket('aw-watcher-afk_'));
window_events = query_bucket(find_bucket('aw-watcher-window_'));
window_events = filter_period_intersect(window_events, filter_keyvals(afk_events, 'status', ['not-afk']));
RETURN = merge_events_by_keys(window_events, ['app', 'title']);""".split("\n")
    data = {
        "timeperiods": timeperiods,
        "query": query,
    }
    r = requests.post(
        "http://localhost:5600/api/0/query/",
        data=bytes(json.dumps(data), "utf-8"),
        headers=headers,
        params={},
    )
    return json.loads(r.text)[0]


def main():
    now = datetime.now()
    timeperiods = [
        "/".join([now.replace(hour=0, minute=0, second=0).isoformat(), now.isoformat()])
    ]
    events = get_nonafk_events(timeperiods)

    total_time_secs = sum([event["duration"] for event in events])
    total_time_mins = total_time_secs / 60
    print(f"Total time: {total_time_mins} seconds")
    hours, minutes = divmod(total_time_mins, 60)
    minutes = round(minutes)
    print(f"Screen Time: {hours} hours {minutes} minutes")

    # show mac notification
    os.system(f"osascript -e 'display notification \"{hours} hours {minutes} minutes\" with title \"Screen TIme\"'")


if __name__ == "__main__":
    main()

This script2 will show the screen time alerts using the Activity Watch API. We can run this script using the below command.

$ python screen_time_alerts.py

Screen Time Alerts

We can set up a cron job to run this script every hour to show screen time alerts.

$ crontab -e
0 * * * * python screen_time_alerts.py

We can also modify the script to show alerts only when the screen time exceeds a certain limit.

Conclusion

Since Actvity Watch is open-source and provides an API, we can extend its functionality to show screen time alerts. We can also use the API to create custom reports and dashboards.